
Understanding where the real estate market is heading requires looking past broad regional headlines and digging into actual local numbers.
Real estate in the Niagara Region is hyper-local: what is happening in Grimsby or Niagara-on-the-Lake differs significantly from market dynamics in Welland, St. Catharines, or Fort Erie. And what happens in one neighbourhood in Crystal Beach doesn’t always apply to the adjacent neighbourhood, for example. Everything comes down to the specific community, within a specific community. That’s the value of hiring a REALTOR® rather than using outdated AI info.
Below is a detailed, city-by-city market breakdown utilizing the latest CREA Home Price Index (HPI) and MLS/Habistat data across 11 Niagara municipalities.
Quick Summary: Key Regional Trends
- Price Stabilization Across Most Municipalities: Month-over-month benchmark prices are flattening (ranging from -2.2% to +0.7%), pointing toward price discovery and seasonal stabilization.
- Long-Term Growth Remains Resilient: Every municipality across Niagara maintains massive 10-year equity gains, ranging from +51.6% in Grimsby to +121.0% in Fort Erie.
- Inventory Influx: Several markets experienced significant month-over-month jumps in new listings (Welland +50.0%, Pelham +58.97%, Lincoln +53.57%, Grimsby +41.67%), expanding choice for prospective buyers.
- Sub-$500k Value Zones: Port Colborne/Wainfleet ($466,000), Fort Erie ($483,300), and Welland ($492,300) continue to represent the most accessible benchmark entry points in Niagara.
City-by-City Niagara Real Estate Breakdown
1. Welland
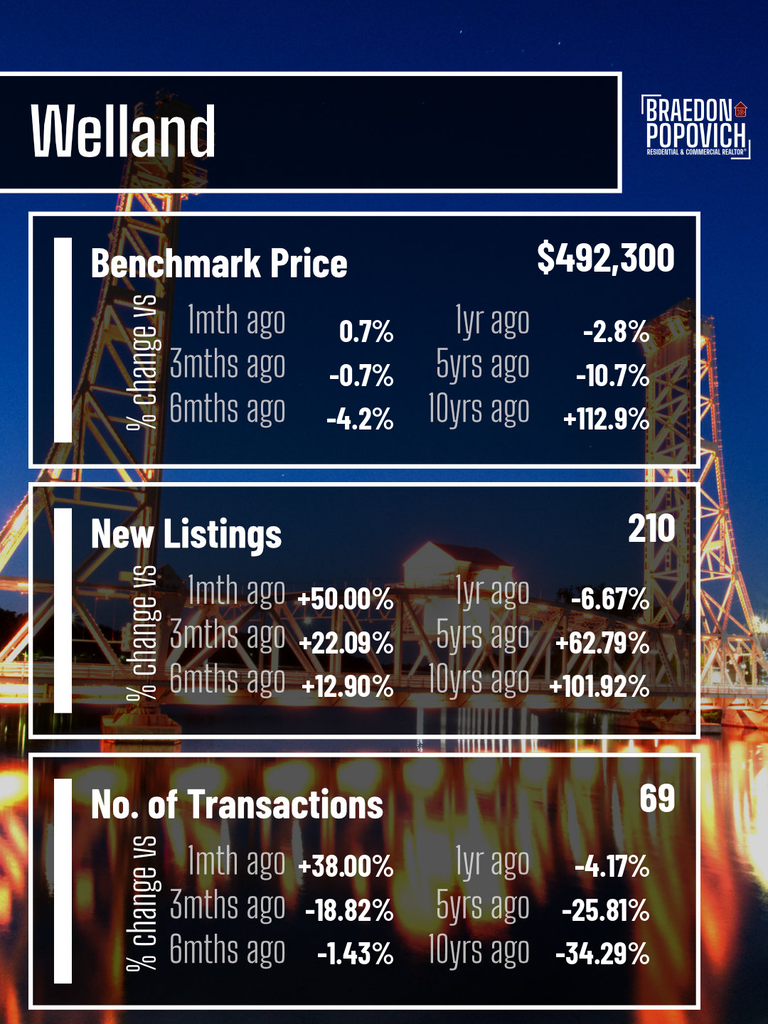
Key Takeaway: Strong transaction activity (+38% MoM) and steady sub-$500k benchmark pricing make Welland a high-liquidity market for first-time buyers and multi-family investors.
2. St. Catharines
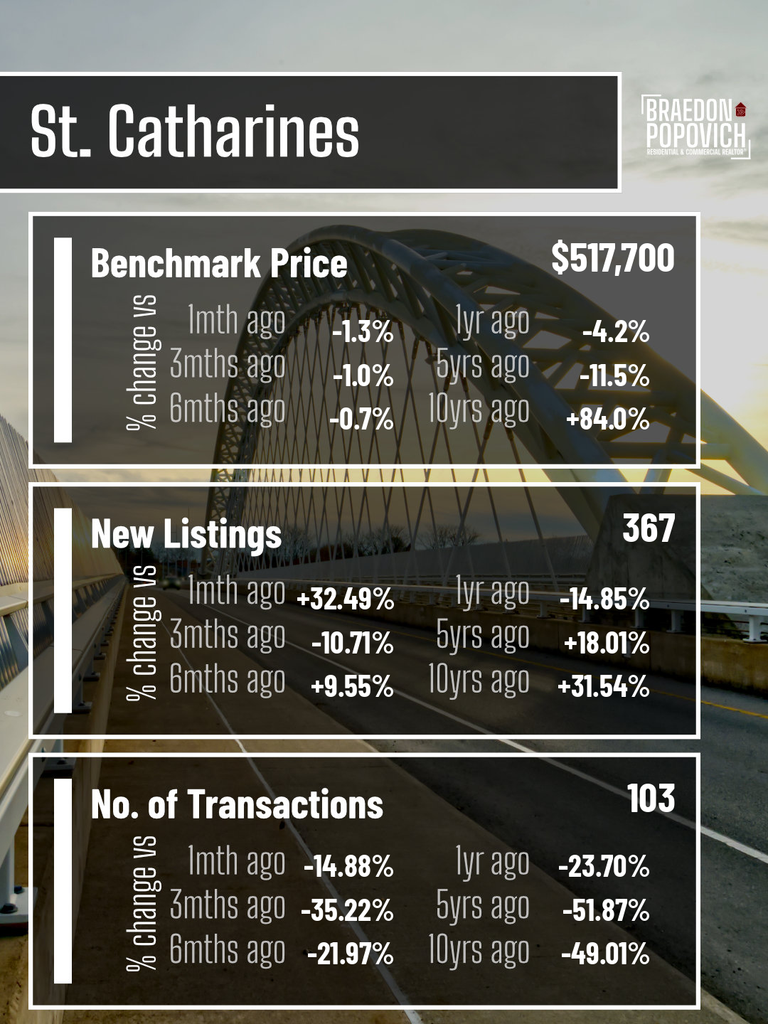
Key Takeaway: Niagara’s largest volume hub saw an influx of 367 new listings, keeping inventory healthy and buyers in a favorable negotiating position.
3. Niagara Falls
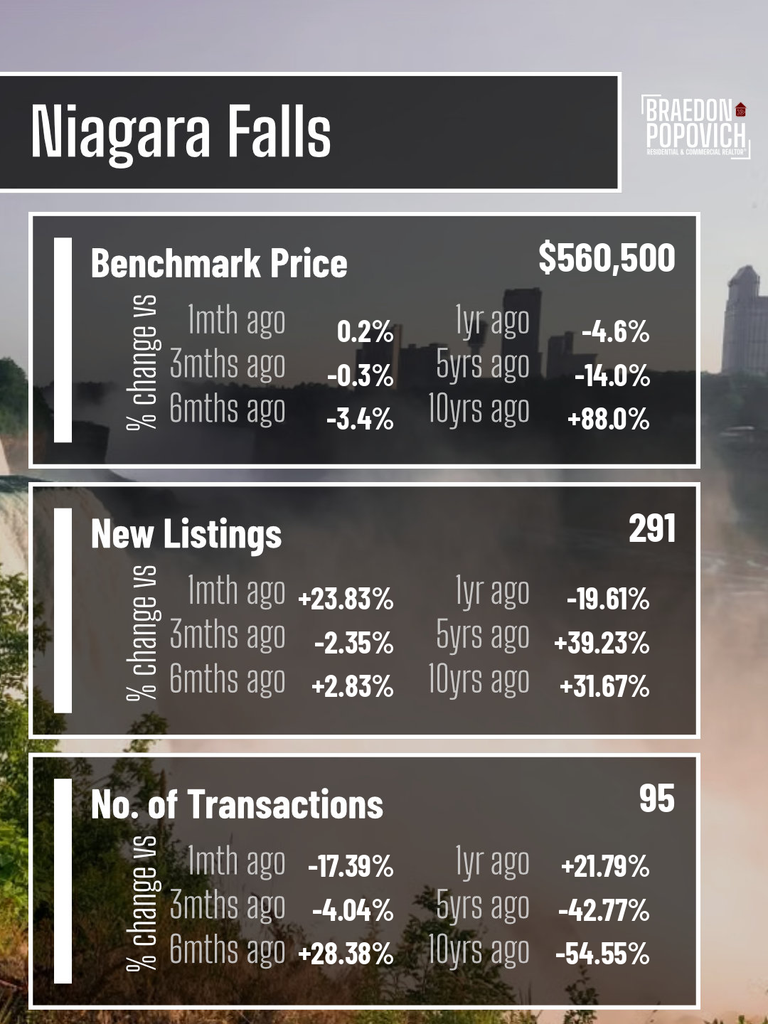
Key Takeaway: Year-over-year sales are up +21.79%, reflecting sustained demand for residential properties and short/medium-term rental opportunities.
4. Grimsby
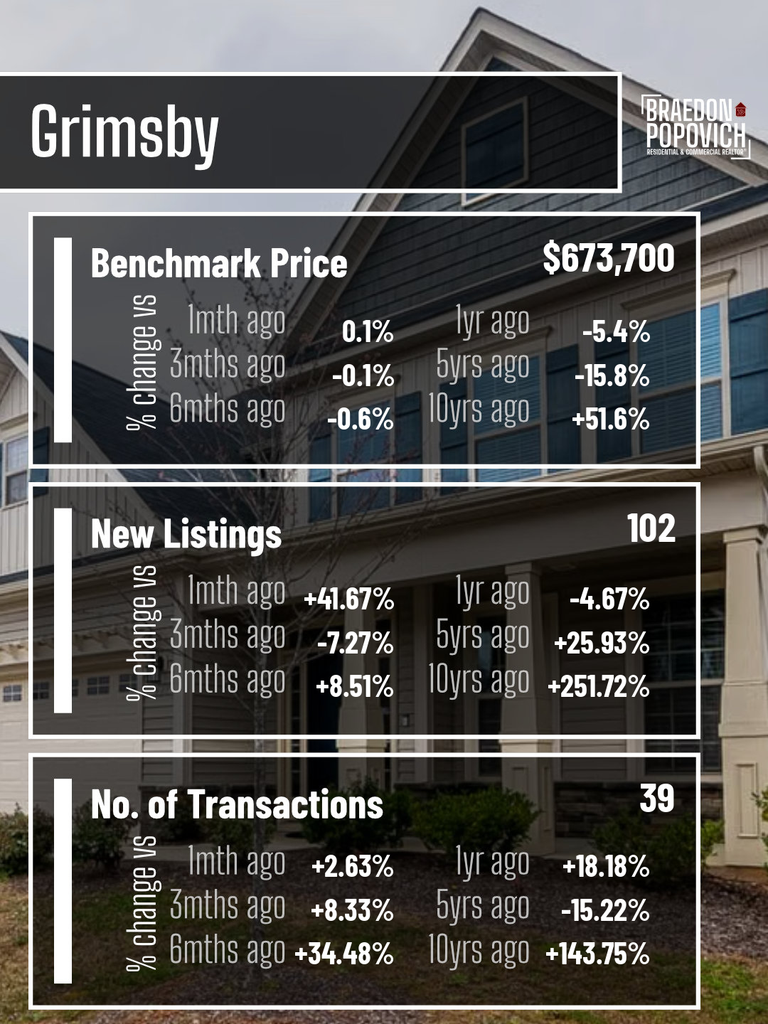
Key Takeaway: Benchmark prices held completely flat over recent months, with strong commuter demand from Hamilton and the GTA supporting sales (+18.18% YoY).
5. Lincoln
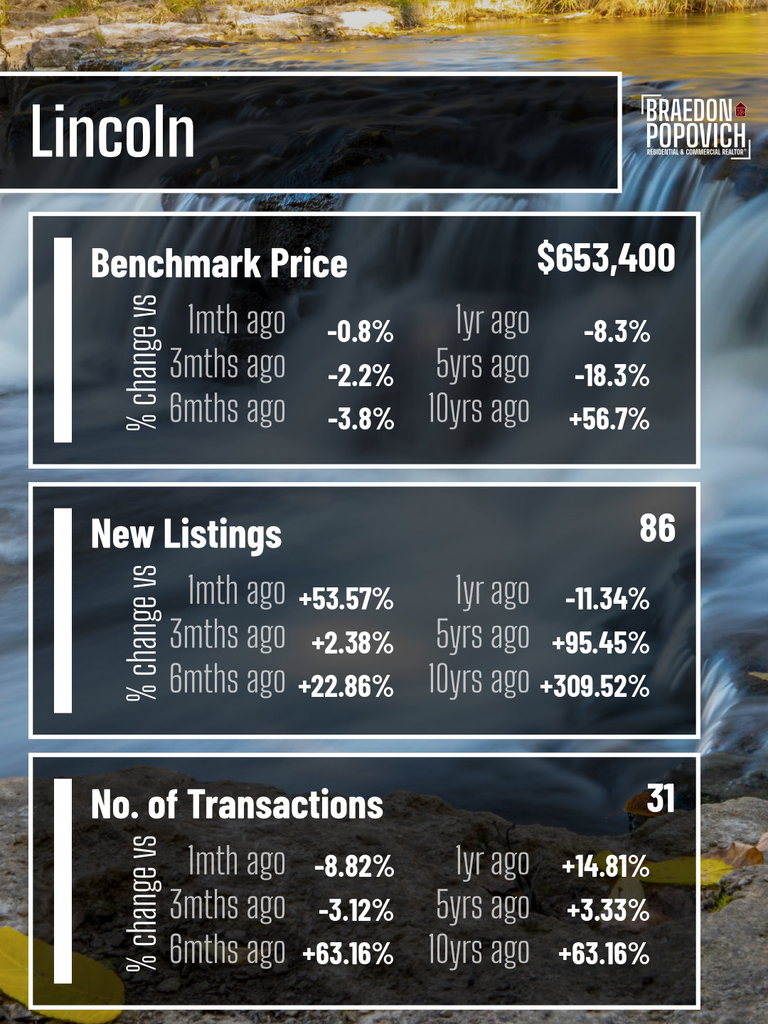
Key Takeaway: A 53.6% jump in new supply provides much-needed options for buyers looking in Beamsville and Vineland.
6. Thorold
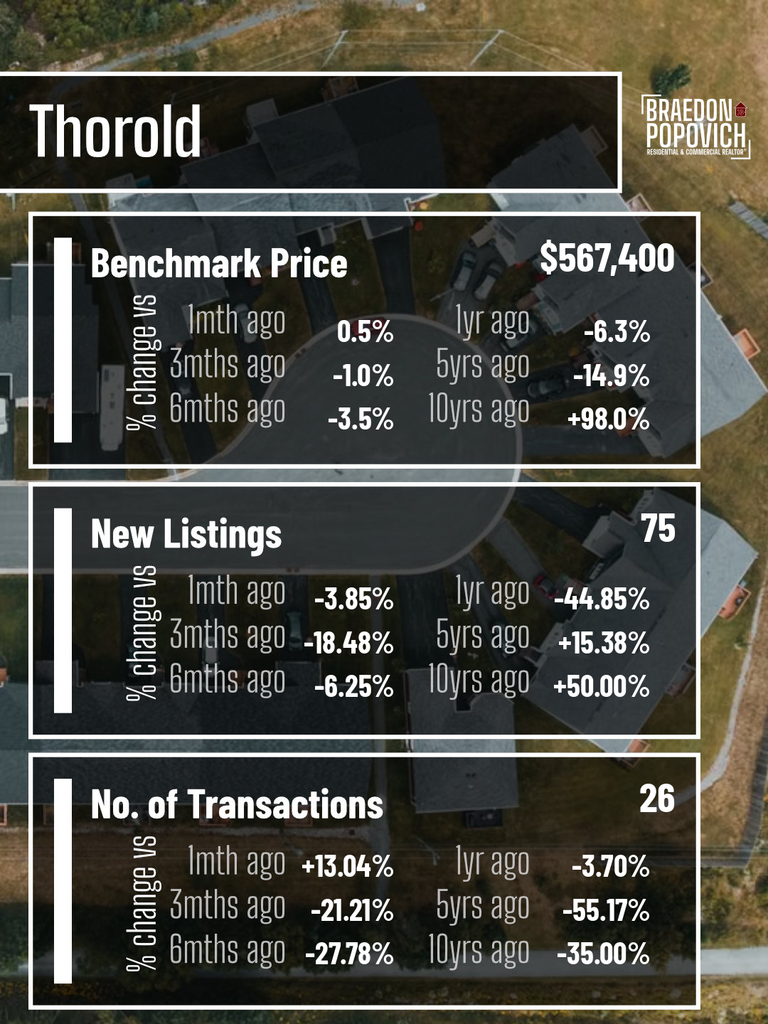
Key Takeaway: Tighter listing volume (-44.85% YoY) has kept benchmark pricing stable, supported by consistent student rental and local end-user demand.
7. Port Colborne & Wainfleet
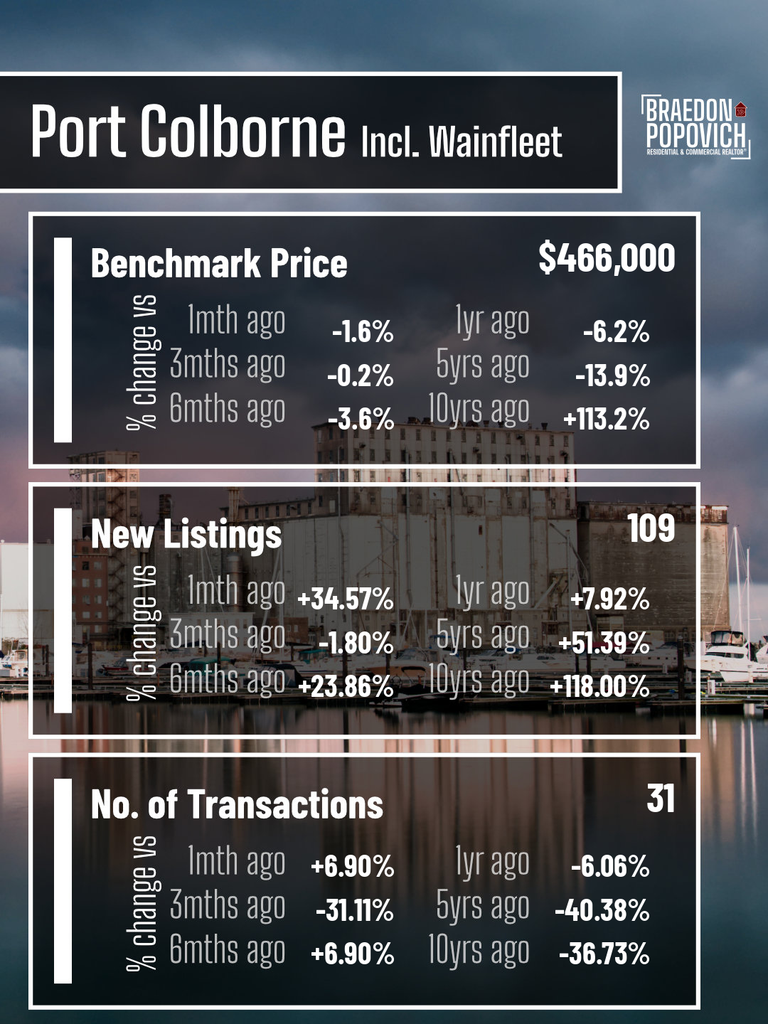
Key Takeaway: Remains Niagara’s most affordable benchmark price point ($466k), offering outstanding long-term equity growth (+113.2% over 10 years).
8. Fort Erie
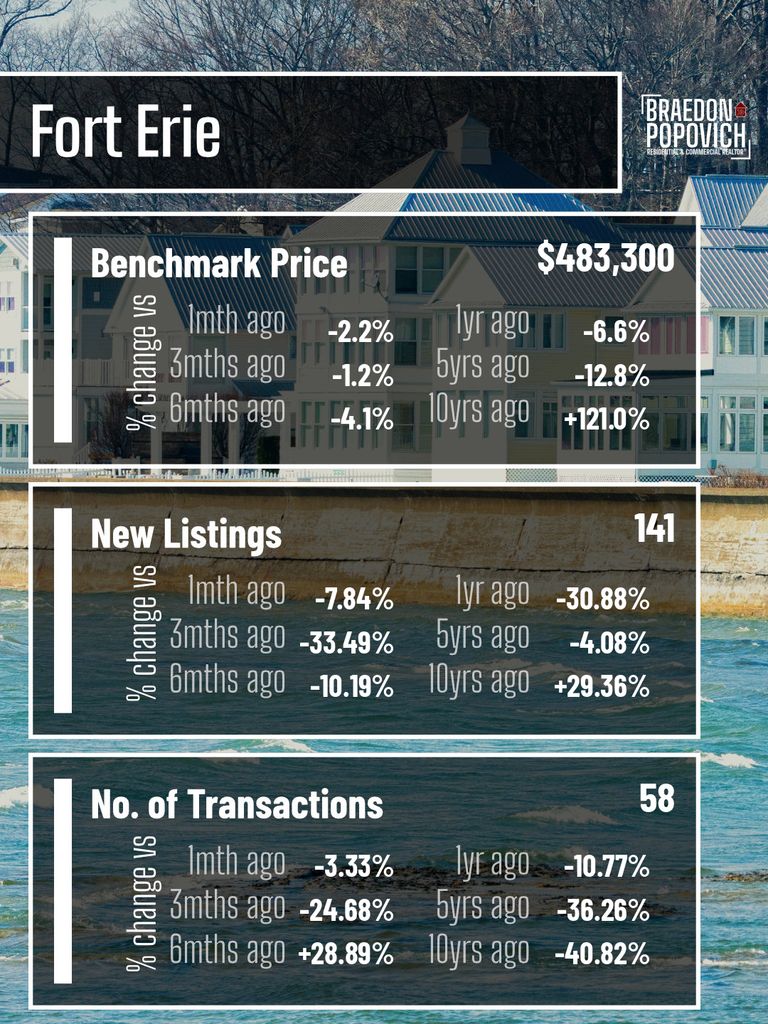
Key Takeaway: Leads the entire region in 10-year appreciation at +121.0%, with accessible pricing below the $500,000 threshold.
9. Pelham
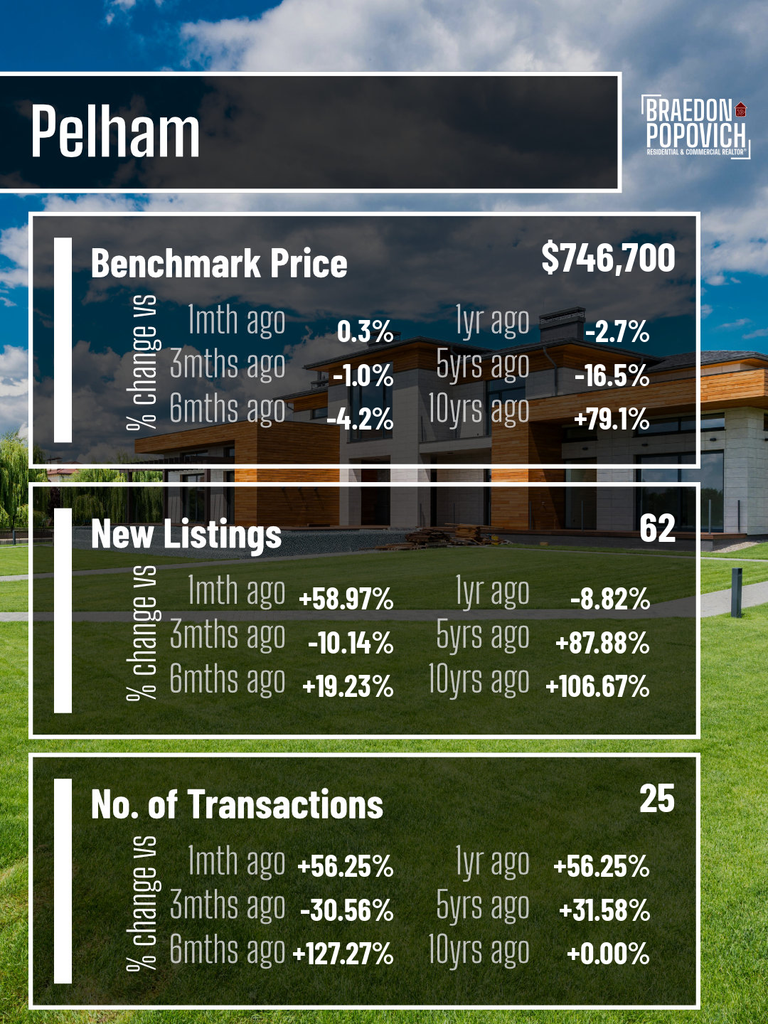
Key Takeaway: A sharp +56.25% YoY surge in transactions, showing strong executive and move-up buyer activity in Fonthill and surrounding areas.
10. Niagara-on-the-Lake
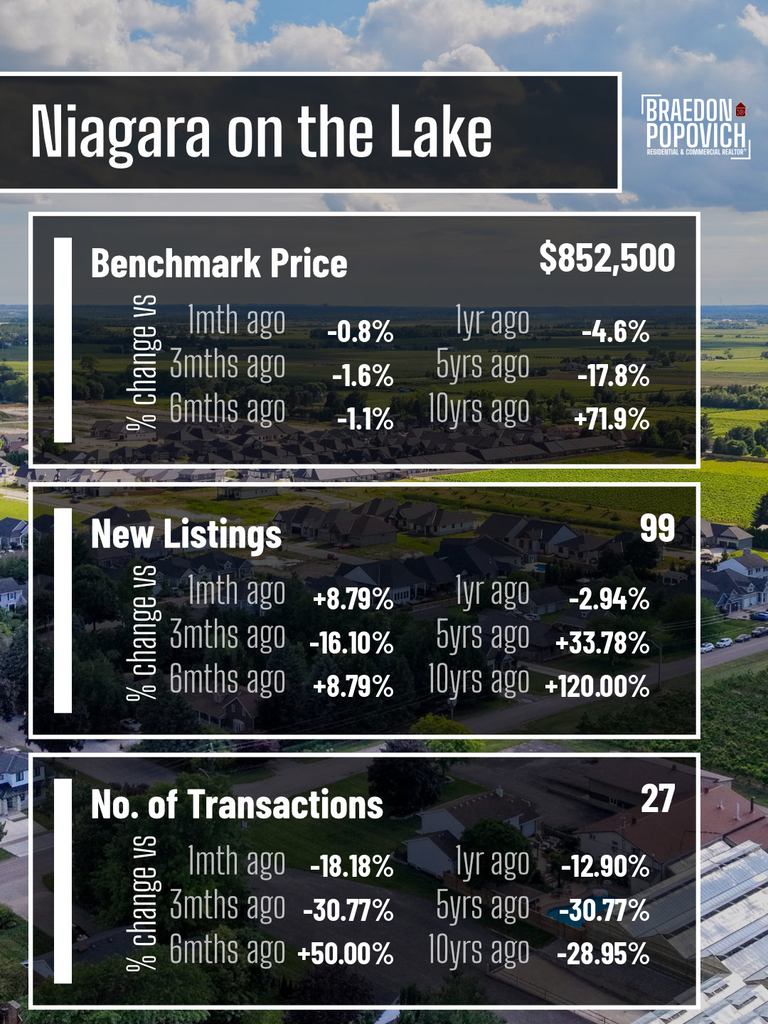
Key Takeaway: The premium benchmark leader in Niagara ($852.5k) remains steady with controlled inventory and discerning buyer transactions.
11. West Lincoln
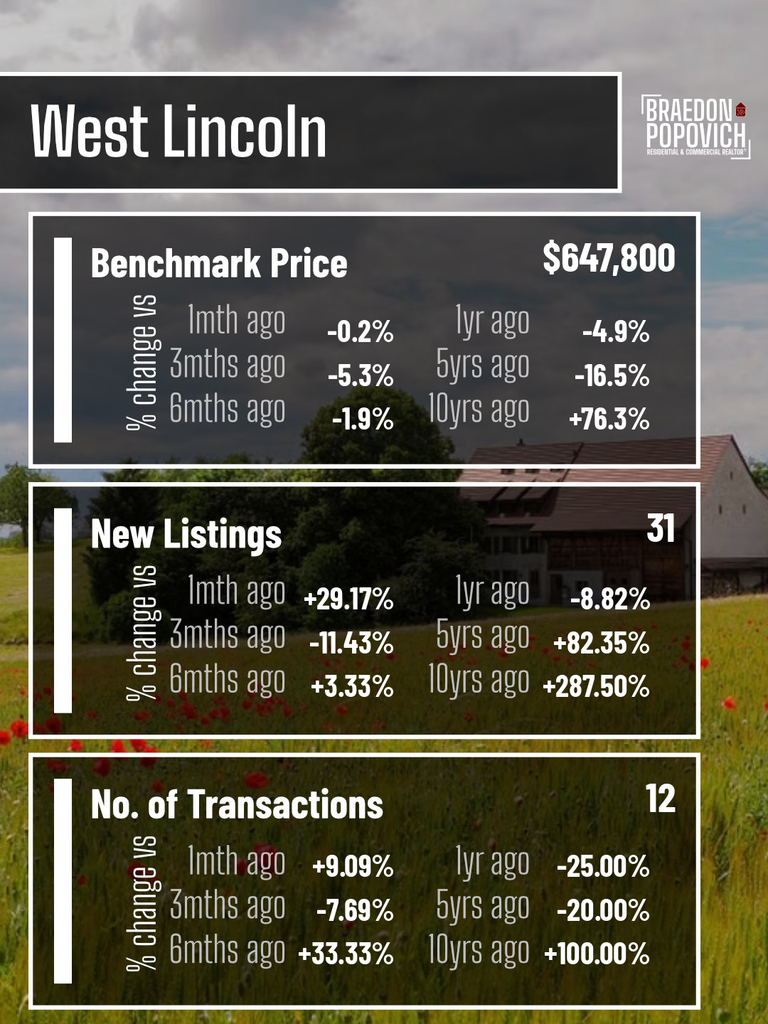
Key Takeaway: Stable township market with consistent rural and residential appeal, up +100.0% in transactions compared to 10 years ago.
Strategic Advice: What the Data Means for You
- For Buyers & Investors: With benchmark prices flattening and inventory expanding in cities like Welland, Lincoln, and Pelham, you have room to negotiate price, terms, and conditions without the pressure of extreme bidding wars.
- For Sellers: Strategic pricing and high-end marketing (pro photography, targeted digital campaigns, clear floor plans) are critical. Homes priced precisely to the micro-market sell; overpriced listings sit.