
Let’s cut through the noise and look at what actually happened in Niagara real estate this August.
If you follow mainstream headlines, you hear extremes—either the market is collapsing or about to boom. The reality is in the data: we are in a balanced, price-stabilized market where execution and accurate pricing dictate everything.
Here is the breakdown of the numbers for August 2026 and what they mean for buyers, sellers, and investors heading into the fall.
1. Regional Overview: August 2026 by the Numbers
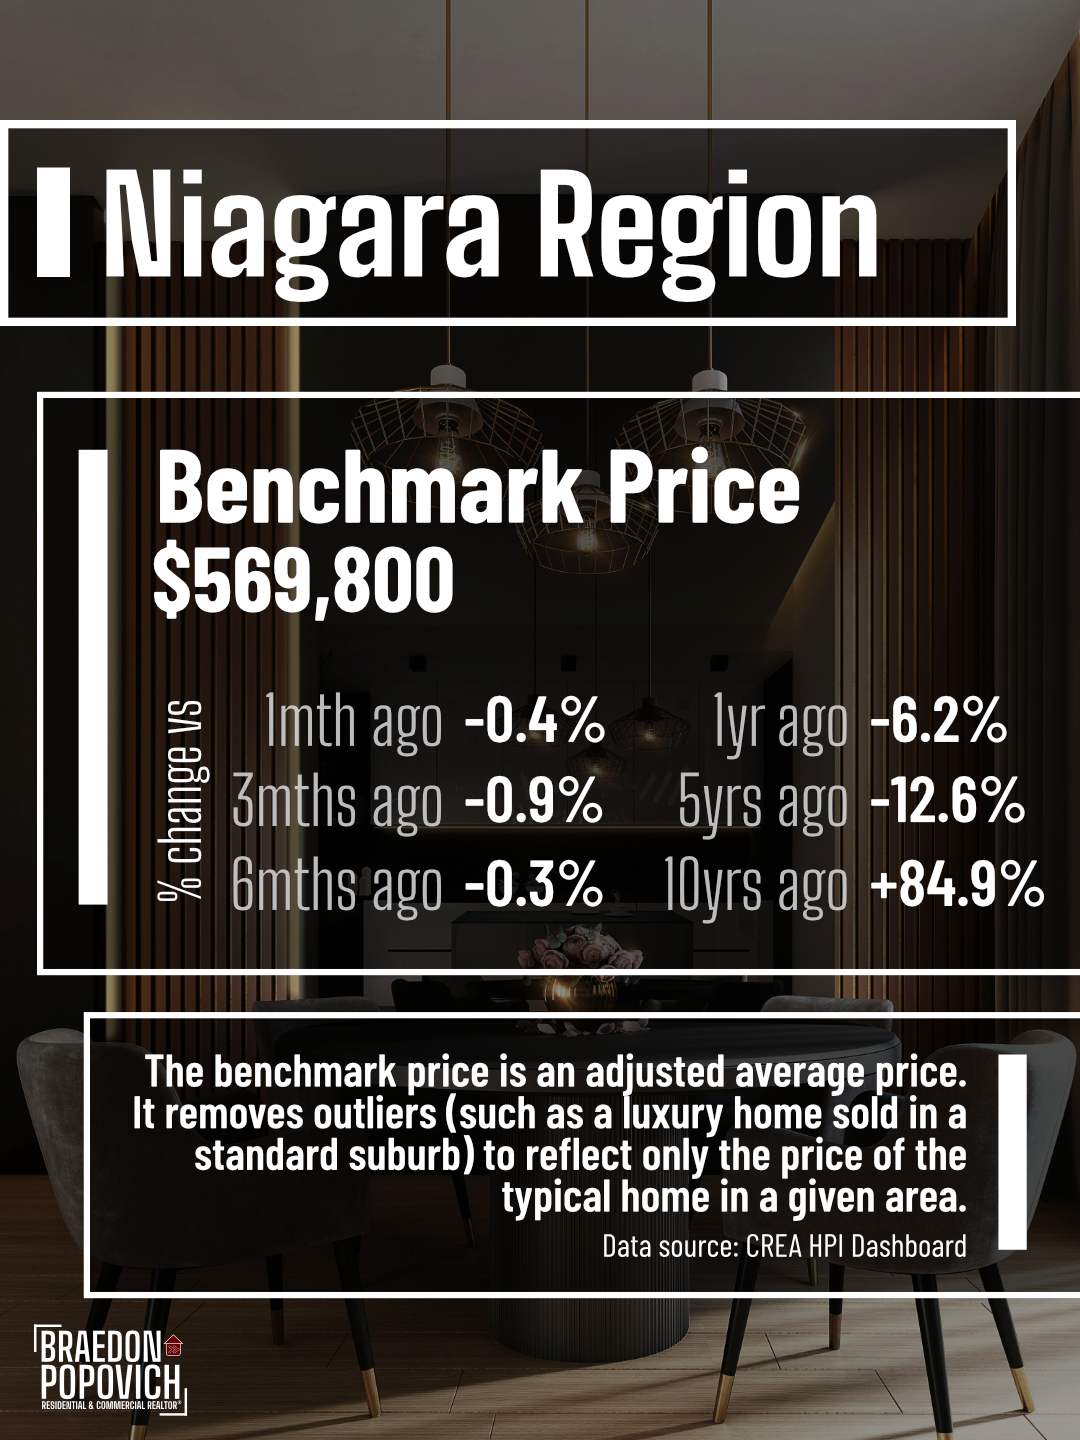
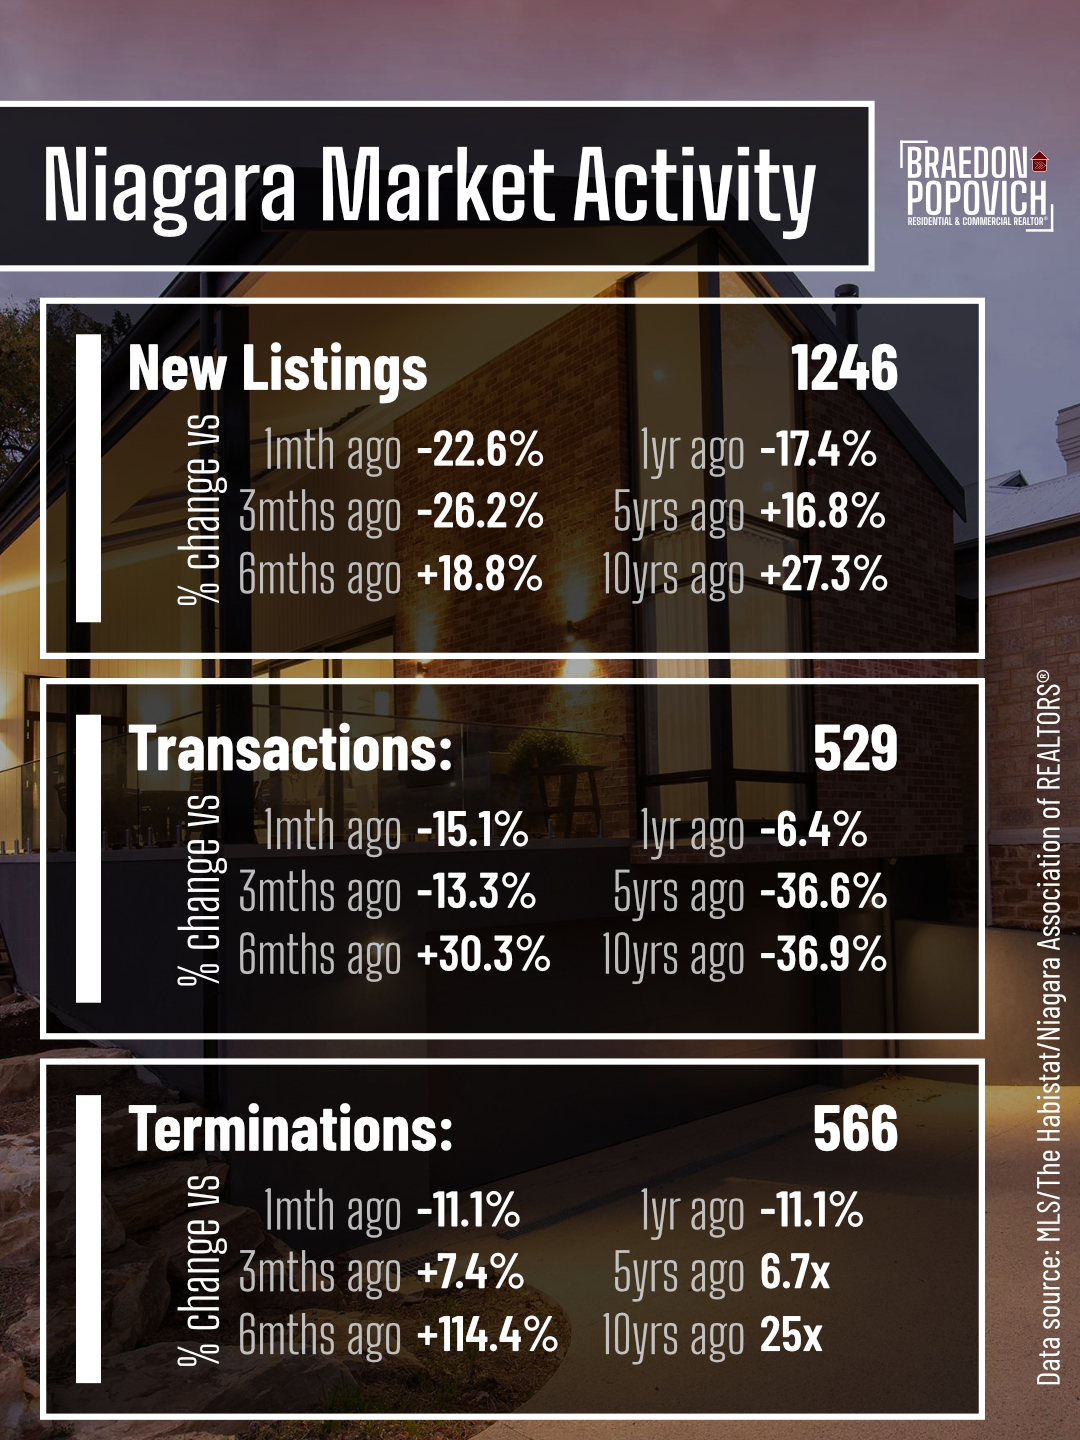
According to Habistat and MLS® data across the Niagara Region:
- Median Sale Price: $580,000 (Down 2.5% MoM from $595,000; down 3.4% YoY from $600,500)
- HPI Composite Benchmark Price: $569,800 (Down 0.4% MoM; down 6.2% YoY)
- Sales Transactions: 529 (Down 15.1% from July’s 623; down 6.4% YoY)
- New Listings: 1,246 (Down 22.6% from July’s 1,610)
- Listing Terminations: 566 (Outpacing actual sales)
- Months of Inventory (MOI): 6.62 Months (Buyer/balanced territory)
- Median Days on Market (LDOM): 34 Days
2. The Biggest Story in the Data: The Termination Wave Returns
The single most telling metric in August is 566 terminated listings.
For context: in August 2021, only 85 listings were terminated. In August 2016, just 22. In August 2026, more listings were cancelled or expired (566) than successfully sold (529).
What does that tell us?
Sellers testing aspirational 2022 pricing are hitting a wall. Buyers are active, but they are disciplined. They aren’t rushing into bidding wars on properties that don’t justify the price tag. Properties that are accurately priced, clean, and well-marketed are selling; properties that are overpriced sit until the listing gets pulled.
Another factor impacting terminations was the flooding in the region, occurring right at the start of the month. While not as strong of an effect as predicted, a major flooding event in Niagara’s busiest real estate market does tend to skew the numbers.
3. City-by-City Benchmark Prices
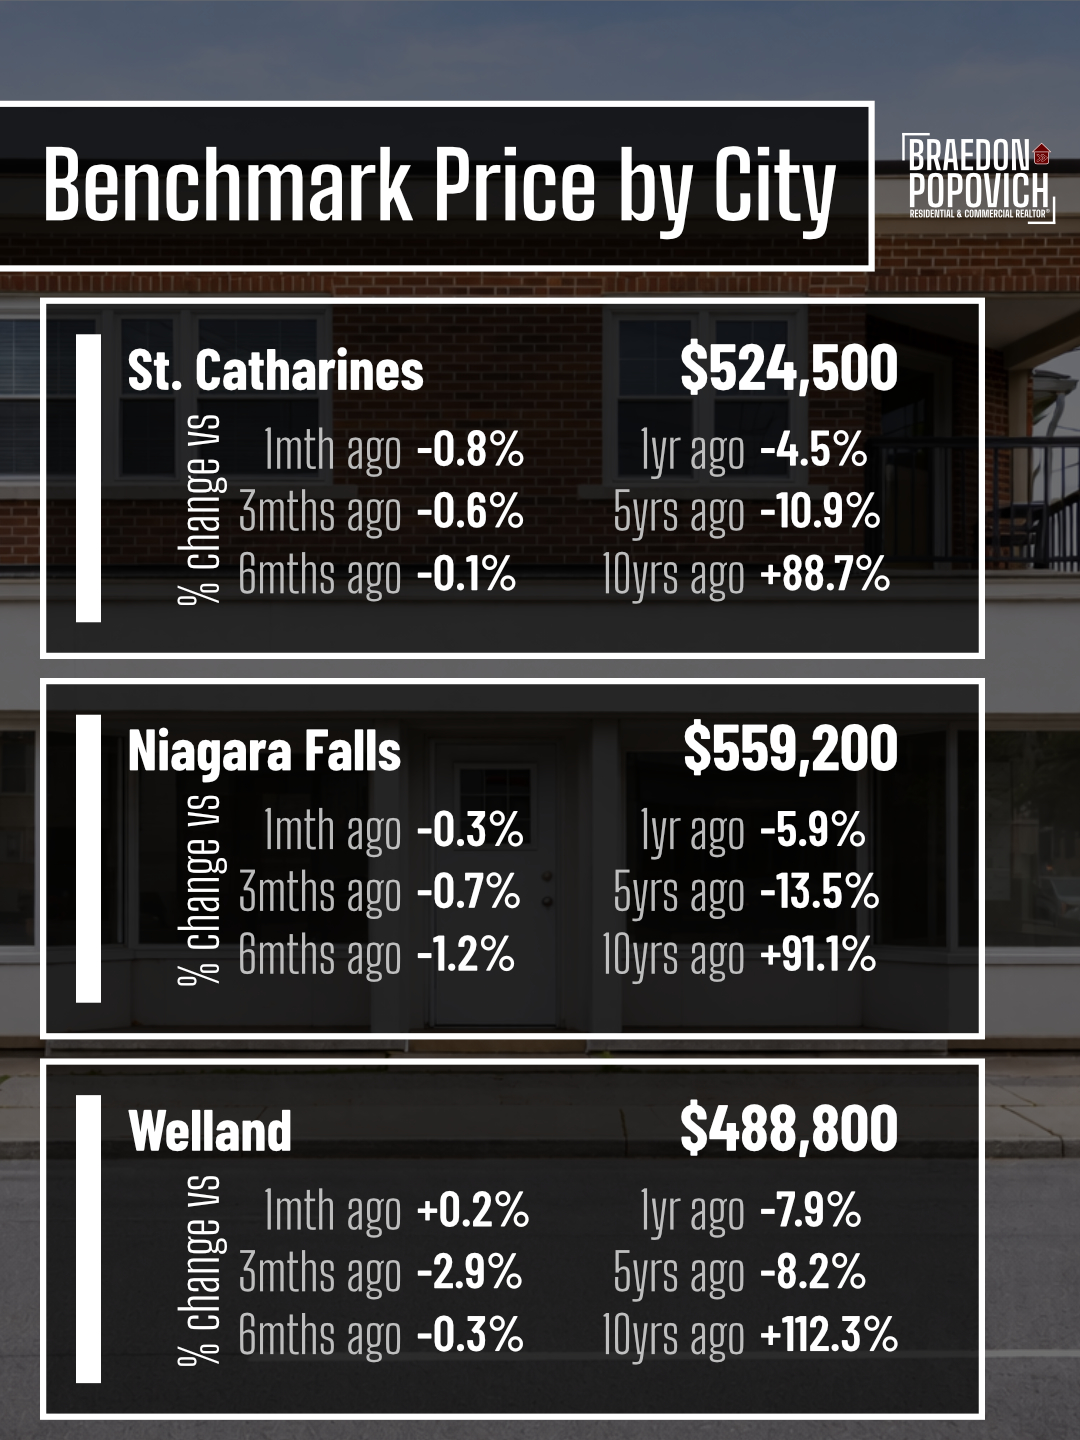
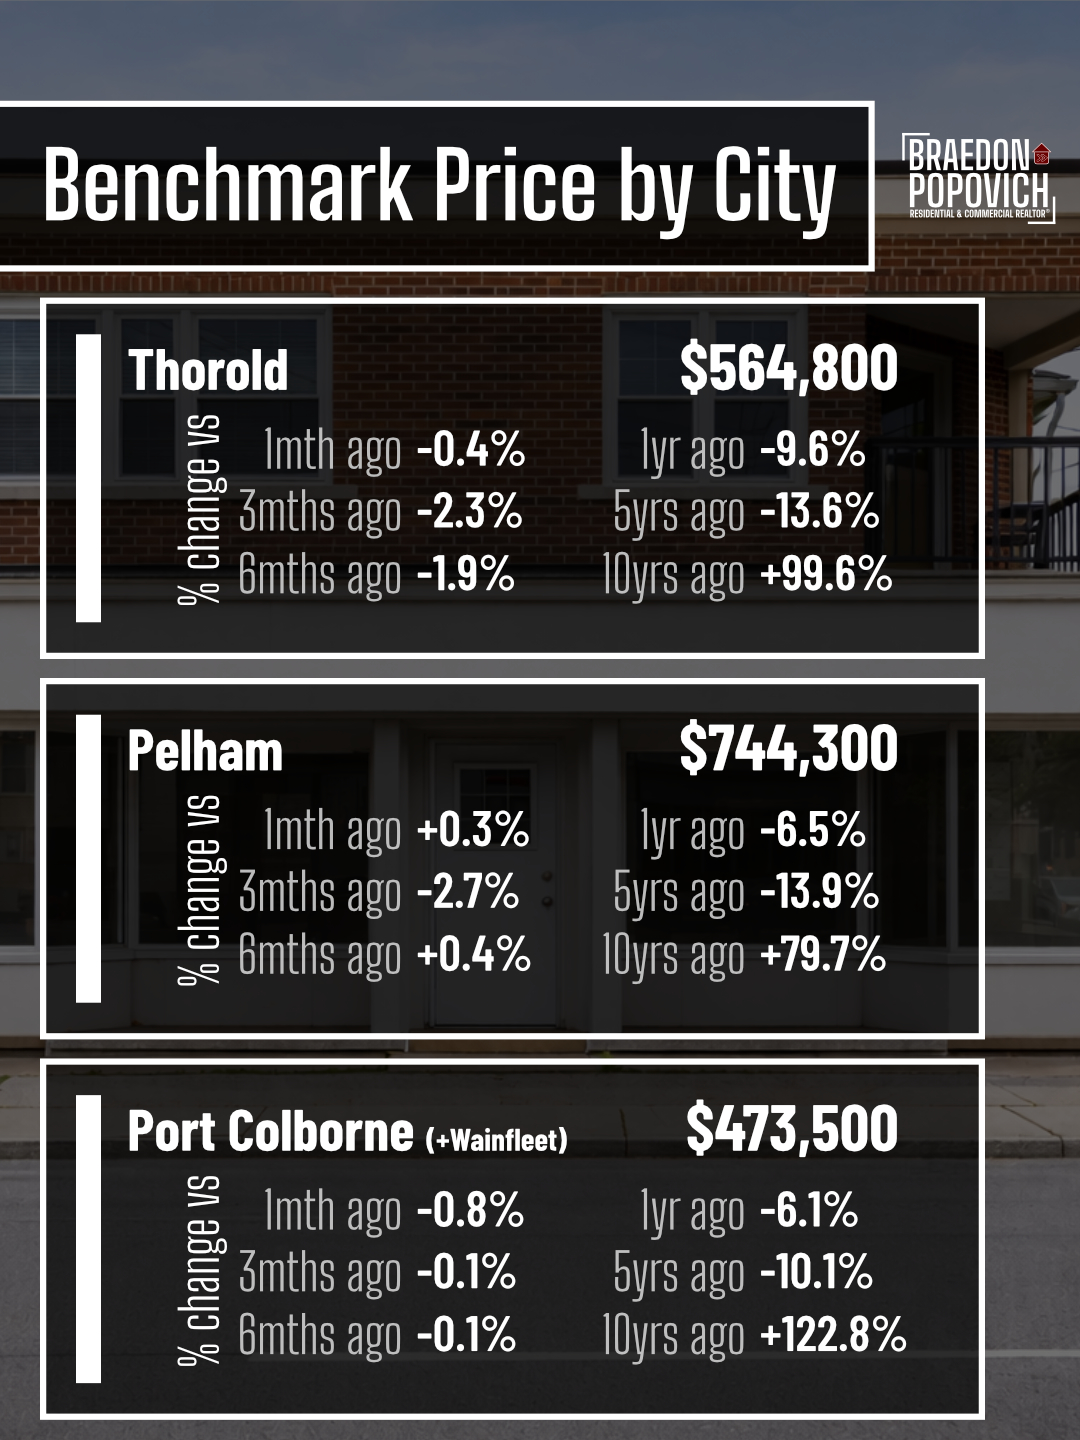
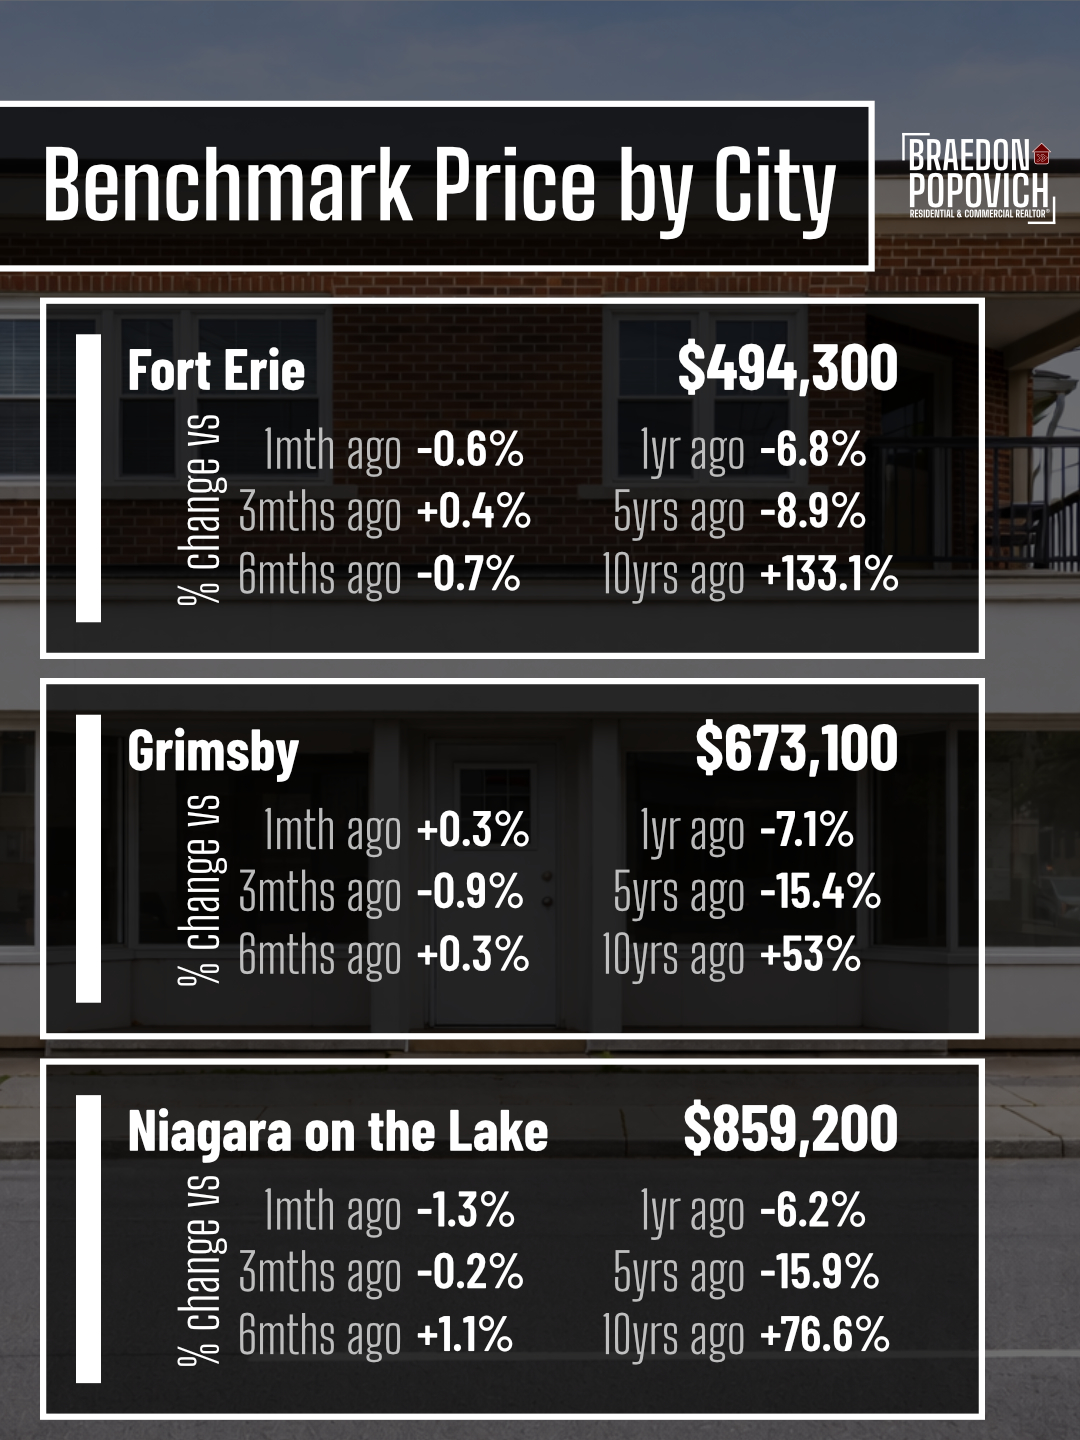
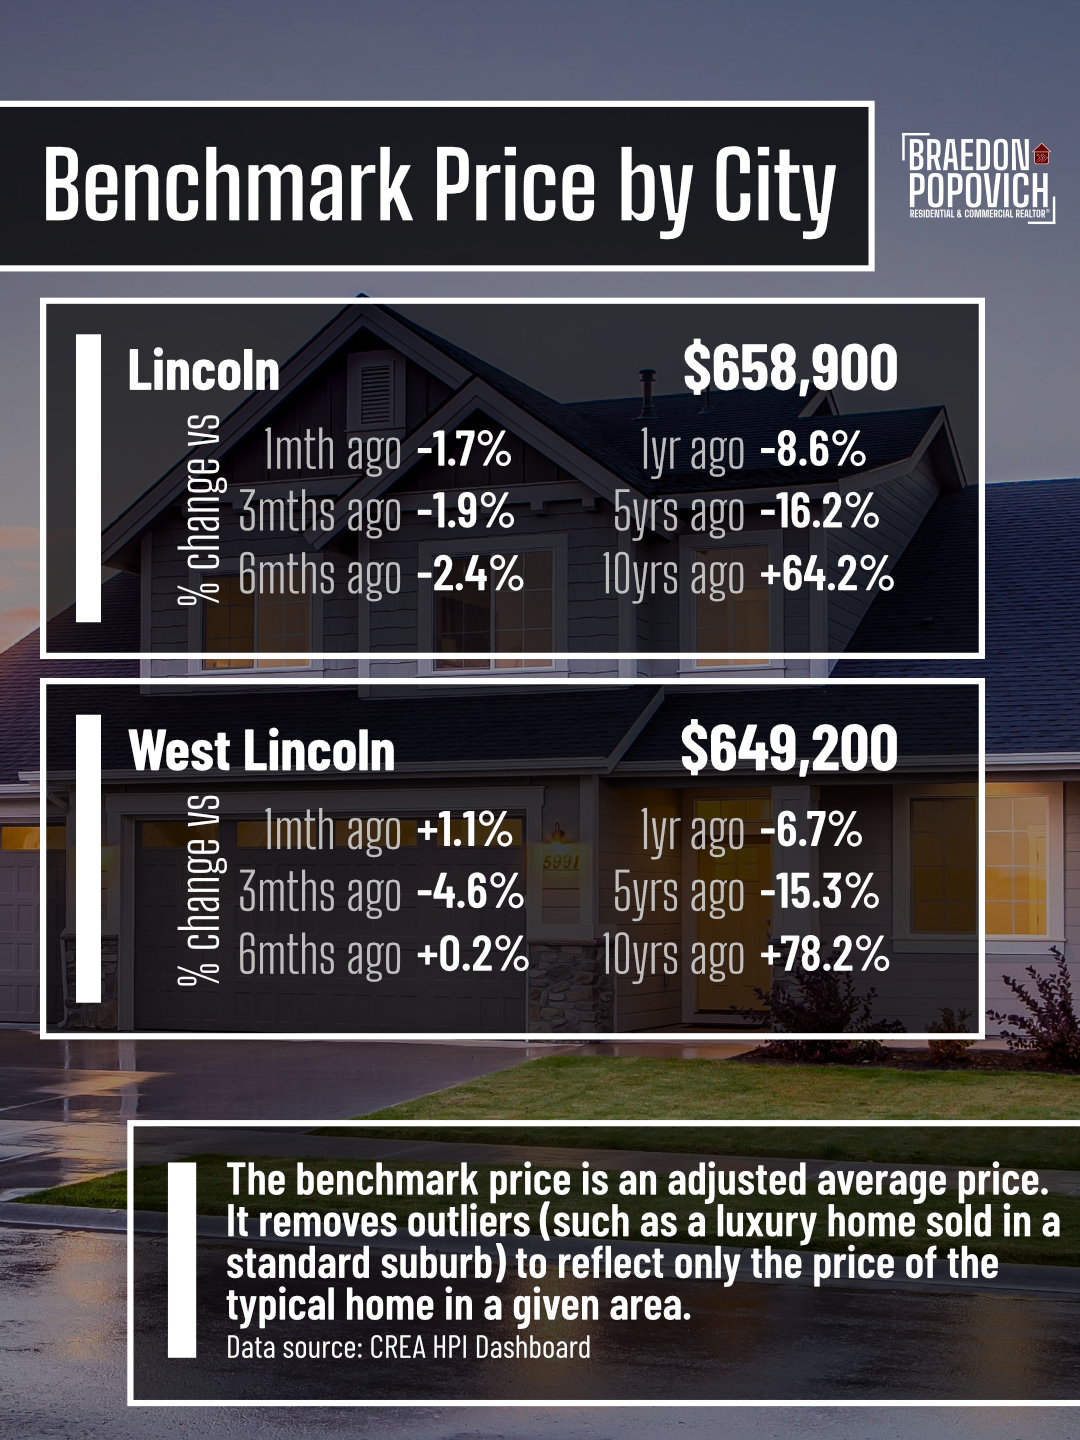
The HPI Benchmark strips out extreme luxury outliers to show the price of a typical home in each municipality:
- Niagara-on-the-Lake: $859,200 (1m: -1.3% | 1yr: -6.2%)
- Pelham: $744,300 (1m: +0.3% | 1yr: -6.5%)
- Grimsby: $673,100 (1m: +0.3% | 1yr: -7.1%)
- Lincoln: $658,900 (1m: -1.7% | 1yr: -8.7%)
- West Lincoln: $649,200 (1m: +1.1% | 1yr: -6.7%)
- Thorold: $564,800 (1m: -0.4% | 1yr: -9.6%)
- Niagara Falls: $559,200 (1m: -0.2% | 1yr: -5.9%)
- St. Catharines: $524,500 (1m: -0.8% | 1yr: -4.5%)
- Fort Erie: $494,300 (1m: -0.6% | 1yr: -6.8%)
- Welland: $488,800 (1m: +0.2% | 1yr: -7.9%)
- Port Colborne / Wainfleet: $473,500 (1m: -0.8% | 1yr: -6.1%)
4. Economic Headlines & The Fall Market
- Bank of Canada Rate Hold (2.25%): The Bank of Canada held its overnight rate steady on September 2nd, marking seven consecutive holds. Rate predictability has given buyers confidence in their monthly carrying costs.
- Weather Disruptions: Two major storm/flooding events in Niagara through August temporarily paused listing activity, pushing some seller inventory into the September/October pipeline. This also impacted terminations in August.
The Bottom Line
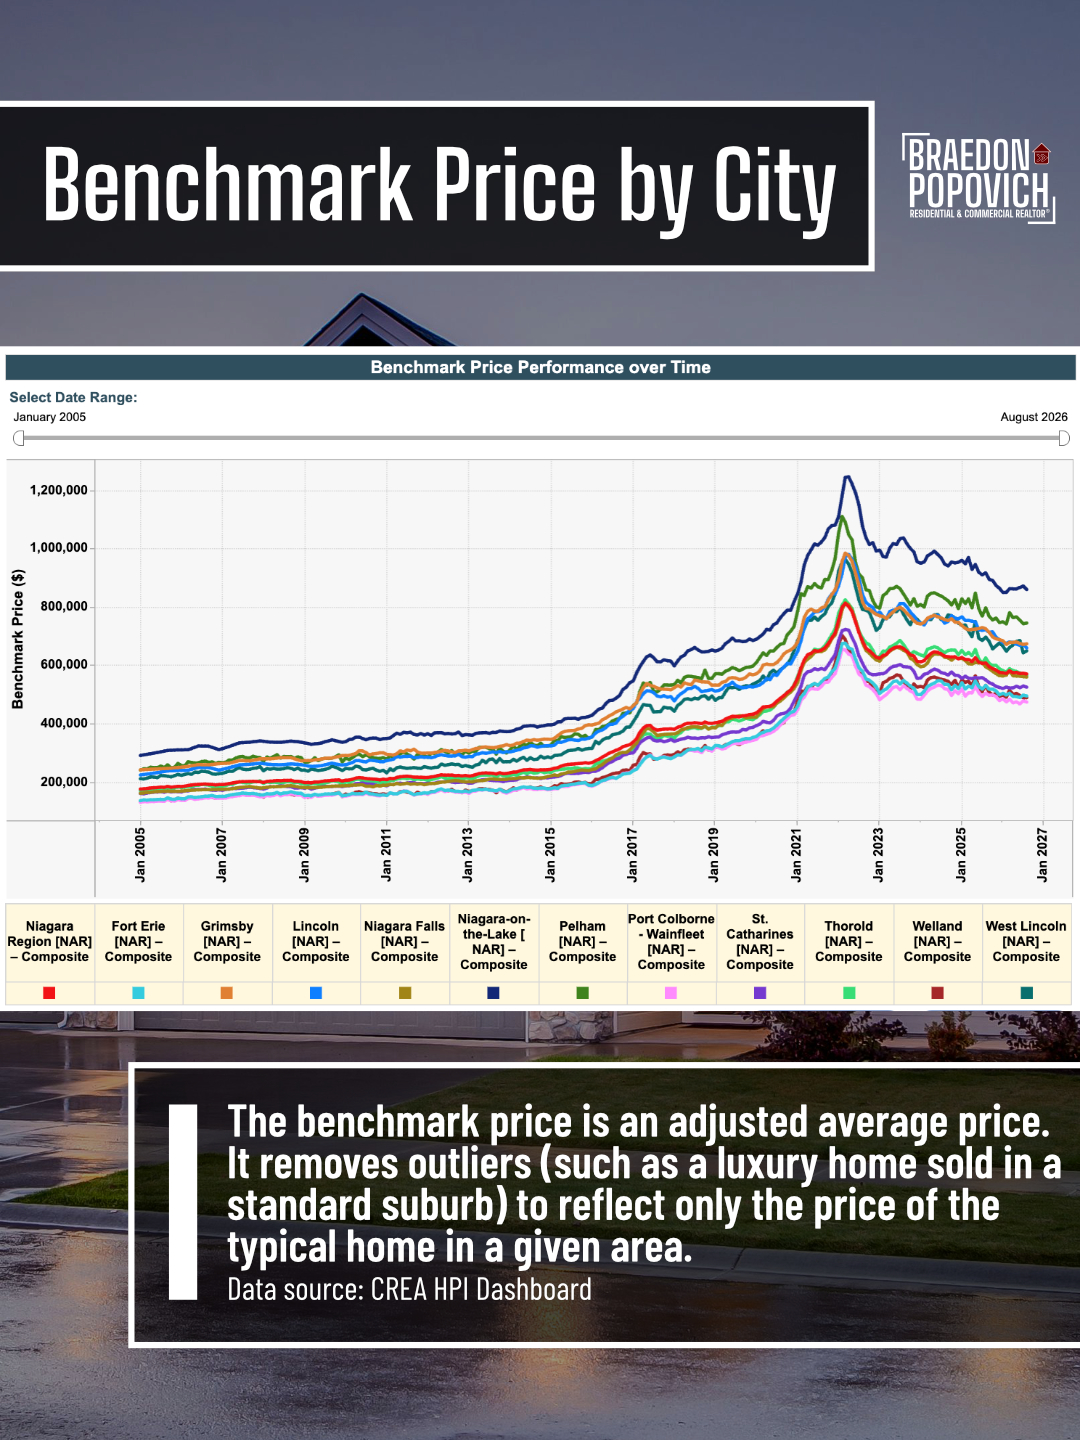
- For Buyers & Investors: You have 6.6 months of inventory, selection, and room to negotiate conditions (financing, inspection). Entry-level markets like Welland ($488k) and Fort Erie ($494k) continue to offer strong fundamentals.
- For Sellers: You cannot “price high to see what happens” in a market with 566 terminations. You need proper pricing that’s reflective of the market instead of your heart, high-end photography/video, and targeted marketing from day one.
Have a property in mind or want to know what your specific home is worth today? Let’s run the real numbers.