


The Optimism is Real!
February delivered a few encouraging signals for Niagara’s real estate market. While prices remain below the highs of 2021, the latest data shows how our market is moving toward stabilization.
It shows in a couple of interesting things that happened in February. They’re what I’ve been anticipating would be happening any day now. I become a broken record when I talk about how markets move in cycles of up and down with a little bit of stability in between.
Price Drops are Slowing Down!
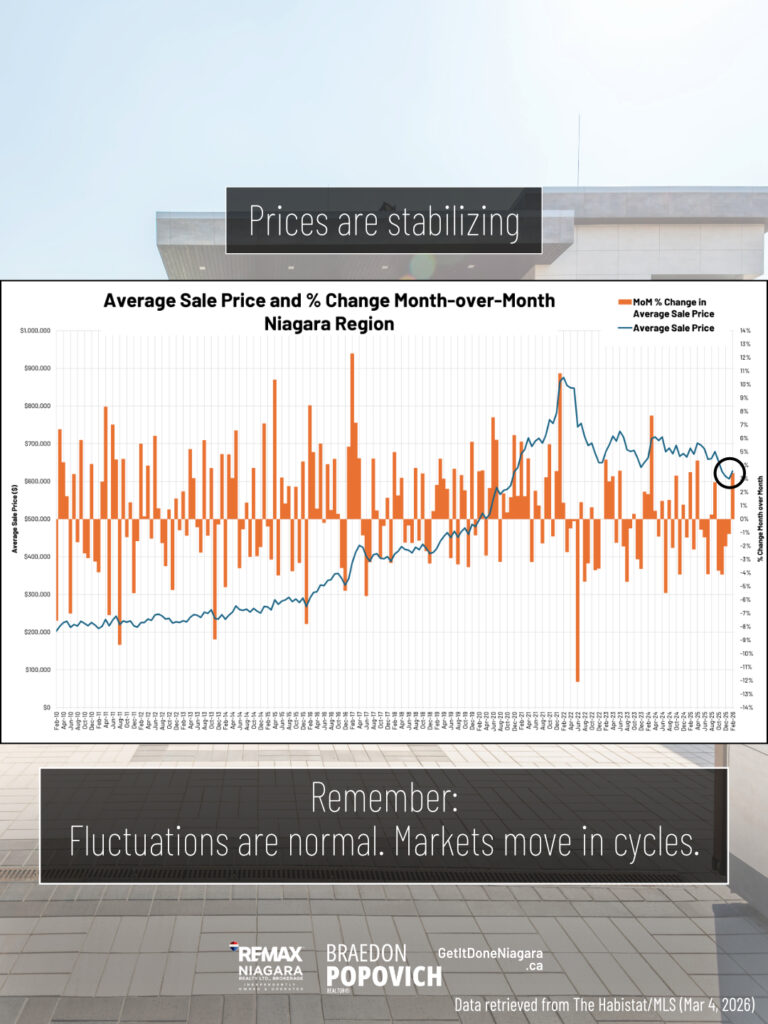
We saw a positive price change in February! But overall, drops in prices have been slowing down and the sale prices are becoming more stable.
Graph Explained: The orange bars are showing the percentage changes in price month-over-month, both positive and negative (with 0 being the middle). I wanted to show how average sale prices are always fluctuating up and down. It’s normal to have periods of incline and decline! The blue line is the Average Sale Price for Niagara. If you follow the line, you’ll see the cycles I am always talking about. BUT the abnormal part was having around ten years of growth within 1.5 years, which led to the inevitable correction that we’ve all been freaking out about this past year. All of that appears to have relaxed.
Transactions FINALLY Exceeded Terminations – Normalcy Returns!
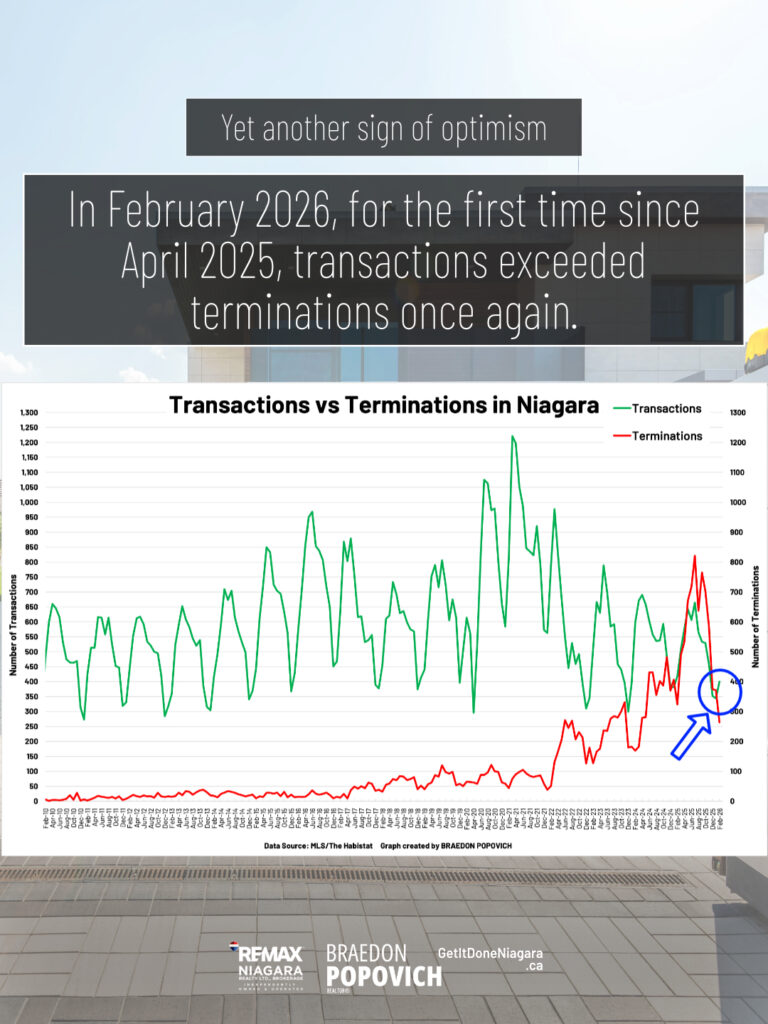
For the first time since April 2025, transactions (green line) exceeded terminations(red line). Prior to the pandemic, it was highly irregular for terminations to exceed transactions in the first place! We’ve returned to the historical norm!
Transactions: 400
Terminations: 264
Does it mean our market is suddenly booming again?
No. But it is a strong signal of improving momentum. Buyers are becoming more active, serious, and satisfied with prices once again. Sellers have adjusted their expectations regarding what their homes are actually worth relative to the market as a whole. Balance has returned!
And if you know me well, I’m always saying “buy low, sell high”. Market corrections are a great time to “buy low”, especially when there’s signs indicating we could be near the end of them.
Stats for Niagara as a Whole
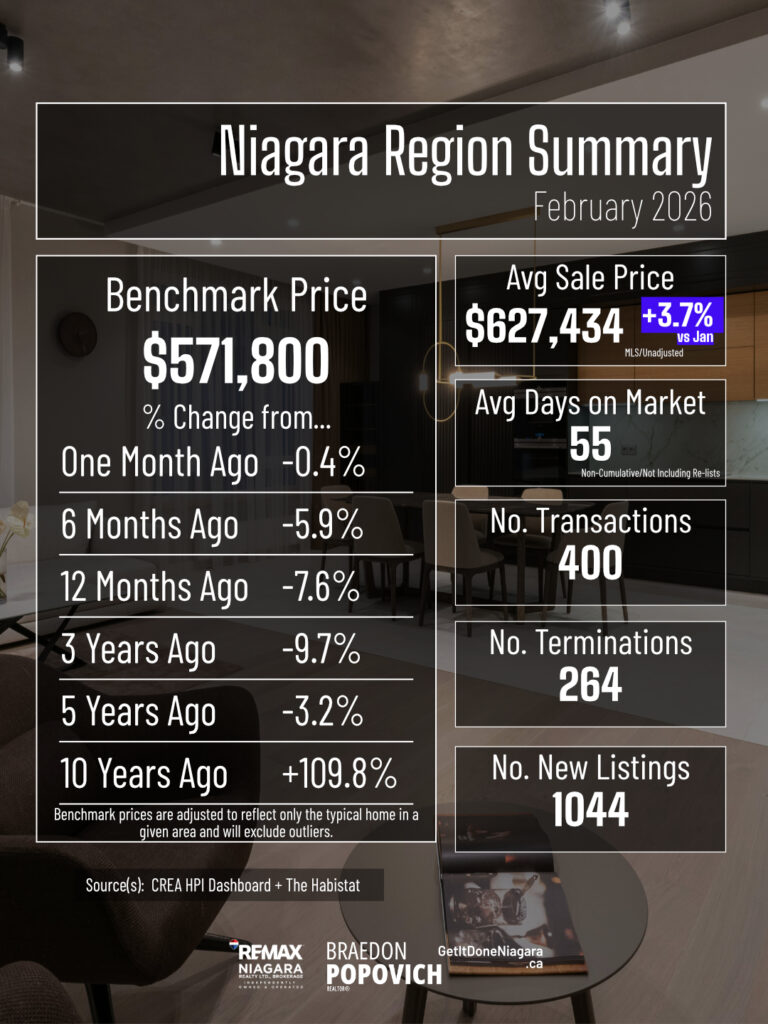
In Niagara, benchmark pricing did still drop a bit, but it’s relatively nothing compared to the price drops we’ve seen over the last couple of years. The price drops have been dropping for the last several months, indicating we’re possibly approaching the end of them! And our MLS Average Sale Price saw a 3.7% increase. Despite the correction, we can still be proud of the 109.8% growth we’ve had over the last ten years, and even more beyond that.
Benchmarks are adjusted to remove outliers (like a luxury mansion in a neighbourhood of smaller bungalows). They reflect the price of a “typical home” in that area and are great for long-term trend analysis. Personally, I like Average Sale Price (unadjusted and straight from MLS) to be included in analysis and discussions. I consider them a reflection of consumer behaviour in addition to price. Plus, they’re what we use when we analyze specific neighbourhoods within a city.
Benchmark Prices by City
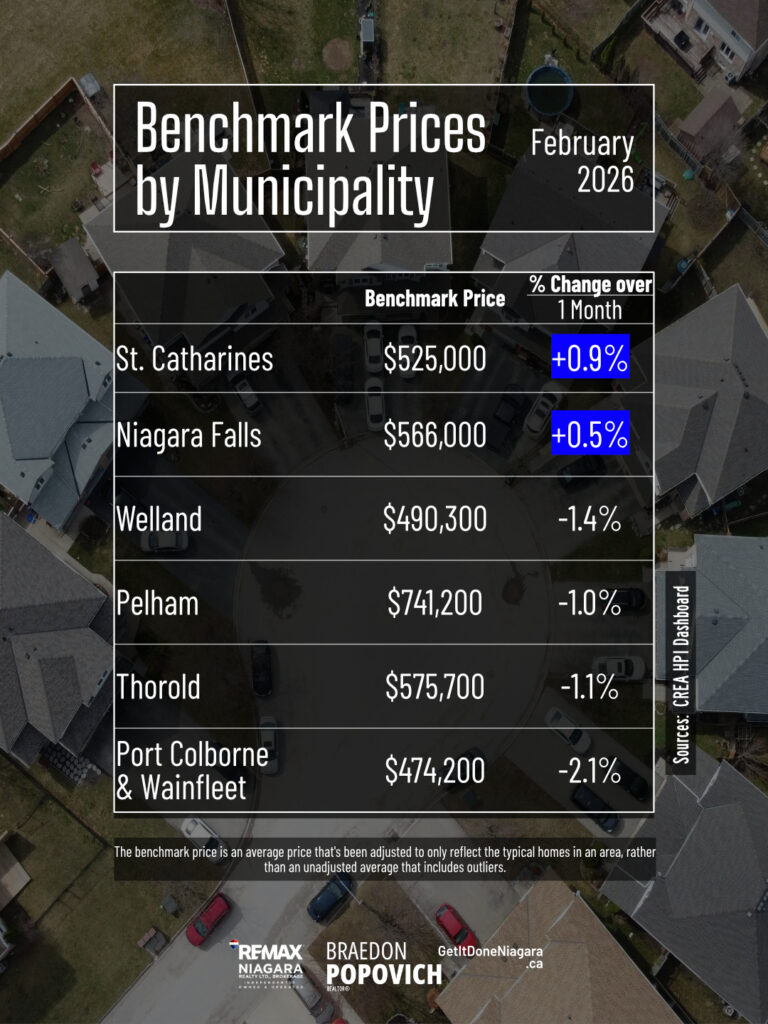
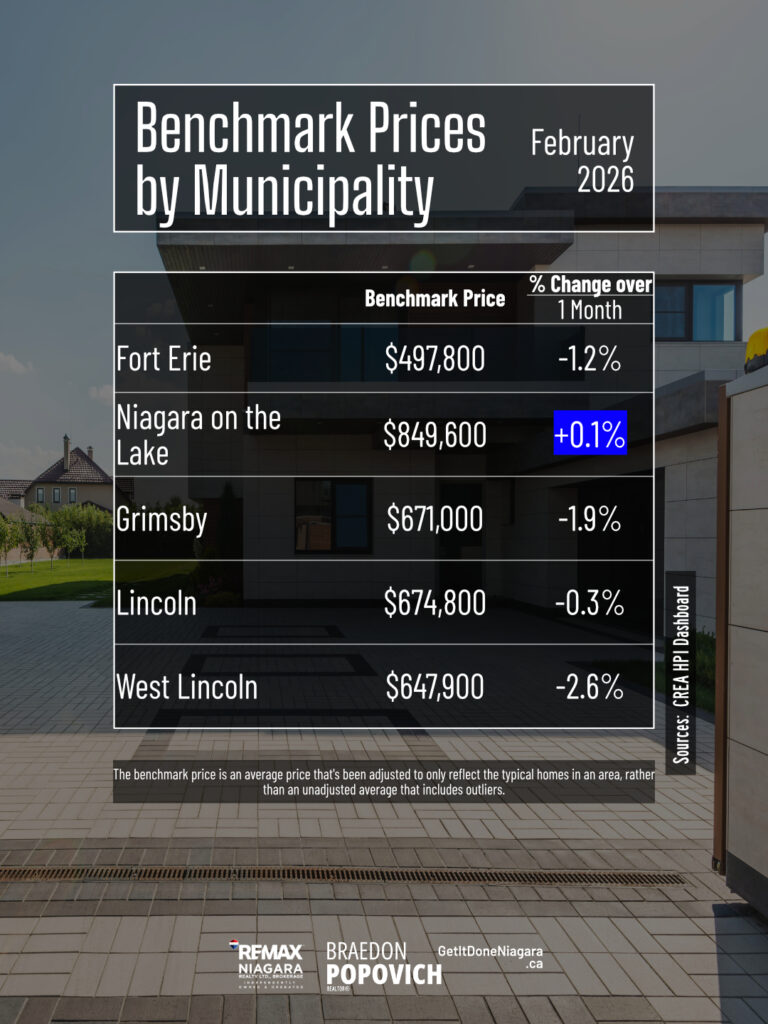
We DID see benchmark price increases in St. Catharines, Niagara Falls, and Niagara on the Lake.
In Conclusion
The February numbers don’t signal a dramatic boom or bust. Instead, they point toward something more important: stability. Prices are fluctuating less and even increasing in some areas. Terminations are declining relative to transactions.
Taken together, these signals suggest Niagara may be moving into a more balanced phase of the housing cycle.
And historically, those balanced phases are often the foundation for the next market upswing.